Preparing For Passage: A Collection of Volatility Trading Resources
Preparing for Passage: A Collection of Volatility Trading Resources

Preparing For Passage: A Collection Of Volatility Trading Resources

While volatility is a product of spot price fluctuations, the spot chart alone doesn’t paint the whole picture of volatility conditions. In anticipation of Passage opening up the world of volatility trading to a new cohort of crypto users, we put together a collection of volatility related charts and resources.
1. DVOL
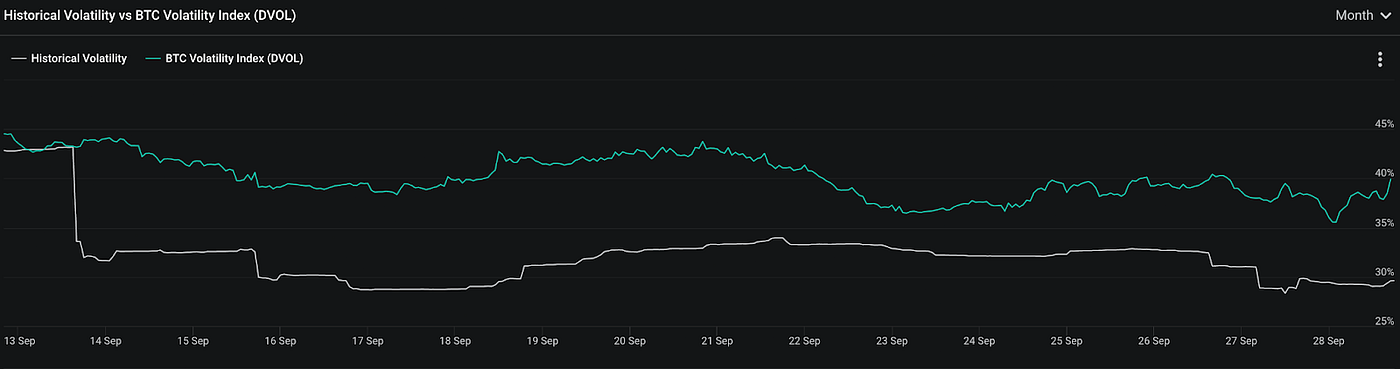
DVOL is Deribit’s implied volatility measure, available for both BTC and ETH. With the majority of crypto options trades being conducted on the platform, it gives a solid forward look at what market participants are expecting in the upcoming month. The index is based on the prices of options contracts that expire ~30 days out, as this gives an indication of how much traders expect spot prices to move during that time period. It’s worth noting that implied volatility for BTC, and to a lesser degree ETH, is historically greater than realized volatility.
To use DVOL for approximating daily implied volatility, divide the figure by 19, so at 60 the expectation is a ~3% move in spot price. As it relates to Passage, a high level of implied volatility would mean the collective options market supports the case for Breakout, while low IV environments would tend to favor a Stay In.
2. Amberdata

Amberdata provides a slate of realized volatility metrics primarily for ETH & BTC as well as some top altcoins. The top chart to watch for BTC is the month-to-daily RV comparison, where the orange trendline gives a nice view of historical realized volatility on a daily basis. Zooming out to a wider time frame can be useful for analyzing current trends in the context of longer-term volatility regimes.
3. Greekslive

Greekslive has a useful collection of volatility metrics for ETH & BTC, with charts including risk premium, term structure, historical volatility, and options flows. VRP, the volatility risk premium, refers to the difference between expected and realized volatility and is worth looking at when deciding between a Stay In vs. Breakout Passage. A negative VRP means that realized volatility is outpacing implied volatility and vice versa.
For Passage traders, a consistently negative VRP could indicate a higher volatility environment where Breakouts are the more favorable choice. A positive VRP typically indicates that options markets are expecting some movement, but spot prices remain stagnant, a scenario that favors Stay Ins until the trend breaks.
Expert Analysis
Beyond just the raw charts, there are some resources worth highlighting for their quality analysis of volatility trends. Marty’s (@thinkingvols on Twitter) newsletter on the Premia blog offers plenty of insights on the crypto landscape from the perspective of a professional volatility trader. Amberdata also runs a blog featuring weekly market analysis, as well as interviews with influential members of the crypto derivatives community.
Ready to Trade?
Starting with Passage Testnet on 10/17, you’ll be able to long or short volatility more simply than ever before. If you’re looking to level up your trading game and prepare for the Passage launch, spend some time familiarizing yourself with the crypto volatility landscape through these charts and resources.
For a full rundown of how Passage works, check out our Introduction Blog and Documentation.
.jpg)
